
Market Mantra – October 2013.
– Vishal Dhawan, Chief Financial Planner, Plan Ahead Wealth Advisors.
Stability returned after a long while this month. Calling this month ‘stable’ would be an overstatement when compared to the rollercoaster movements of stock market indices, currency, gold and also the newsflow during the last few months. Towards the end of the month, the Sensex rallied to the levels of 21000. Long Term bond yields also appear to have stabilised, and the rupee pulled back sharply against the US dollar. Despite so many positives that emerged during the month, the sentiment that seems to be prevailing in the minds of investors is fear. The fear that the Sensex being at the same point where it was 5 years ago – have the stock markets reached their peak, now that the Sensex is at 21000 will it start falling?
This behaviour is dictated by the principles of Fear and Greed in market cycles. Behaviour of investors was driven by greed close to 2008 and the same greed has been replaced by fear now. There seem to be two major facts which are being completely overseen:
1. Time Frame – Is a 5 year time frame really a good indicator of actual performance? Or are longer term performances in the range of 10-15 years better indicators of equity market performance. As we can see in the data below there are various aberrations in the data in 1 year and 5 year time frame on both the positive as well as negative ends. However, 10 year and 15 year data indicate stability of returns. (Data points are as of 31st March for each year, CAGR for BSE SENSEX).
| Rolling 1 Year Growth | Rolling 5 Year Growth | Rolling 10 Year Growth | Rolling 15 Year Growth | |
|---|---|---|---|---|
| 2003 | -12.11% | -4.77% | 2.94% | 14.54% |
| 2004 | 83.37% | 8.37% | 3.99% | 14.71% |
| 2005 | 16.13% | 5.36% | 7.13% | 15.16% |
| 2006 | 73.73% | 25.63% | 12.85% | 16.32% |
| 2007 | 15.89% | 30.38% | 14.55% | 7.72% |
| 2008 | 19.68% | 38.69% | 14.92% | 13.70% |
| 2008 | -37.94% | 11.67% | 10.01% | 6.49% |
| 2009 | 80.53% | 21.97% | 13.36% | 11.86% |
| 2010 | 10.94% | 11.51% | 18.36% | 12.40% |
| 2012 | -10.50% | 5.89% | 17.50% | 11.59% |
| 2013 | 8.23% | 3.18% | 19.97% | 11.08% |
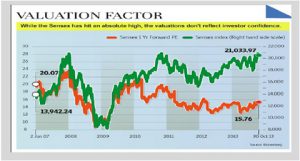
2. Valuations – There is a huge gap between the valuations now and then, even if the topline SENSEX values are the same .During the year 2008 the Price Earnings Ratio for the Sensex was in 20s and now it’s in the range of 14-16.
Below is the example of how the returns of 3 investors who gave contrasting reactions to the 2008 crises. The assumption is built around that each investor invested in one unit of Sensex on 31st March 2003 and the data points for all the years considered are as of 31st March.
1. Investor 1 – Panicked due to the overall negativity in the environment and thought that its better if he stays in Cash and therefore invested in a liquid fund.
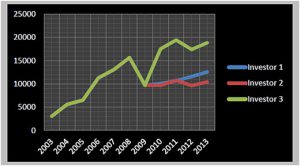
2. Investor 2 – Panicked and exited the markets in 2008. In 2009 again when the markets took upward momentum invested the same amount he had exited.
3. Investor 3 – He is a rational investor. He told himself ‘Its okay if the markets are negative. I am not sure where the markets will go but I am sure that we cannot take calls on market movements. What I know is that I have to stick to my plan.’
Ultimately, we strongly recommend that investors stick to their overall plan and not change asset allocations in reaction to the temporary fluctuations and newsflows.