

Image Source: AI-Generated
As we navigate through markets, virtually always, global markets continue to demonstrate a fundamental truth: no single asset class outperforms in every environment. Macroeconomic conditions naturally shift across expansion, inflation, recession, and market panic, rotating capital toward assets best equipped to withstand specific headwinds.
To build a diversified portfolio investors must look beyond simple stock and fixed deposit models. A comprehensive strategy requires evaluating Equities (domestic and international), Debt (Fixed Income), and Physical Assets (real estate, commodities, and gold) across every phase of the economic cycle.
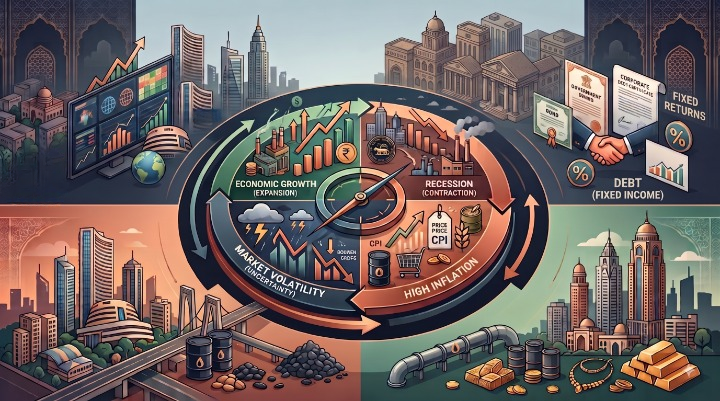
Economic Cycle Breakdown: The Four Market Phases
The global economy continuously cycles through 4 macroeconomic environments:
- Economic Growth i.e. Expansion: Real Gross Domestic Product (GDP) increases, unemployment falls, industrial production expands, strong corporate earnings, and active consumer spending.
- Recession i.e. Contraction: Aggregate economic activity shrinks, contraction of GDP, slowing business activity, and falling corporate profits, usually accompanied by central bank rate cuts to stimulate borrowing.
- High Inflation: The general prices of goods and services rise rapidly, increase in operational costs for industries and hike in living expenses for consumers. It may also trigger central bank to increase interest rates.
- Market Volatility (Uncertainty/Panic):Asset prices swing violently in both directions and there are sudden liquidity squeezes, geopolitical turmoil, or systemic shocks that lead to sharp market drops.
Asset Class Behaviour Across Economic Phases
- Equities (Domestic vs. International)
Equity means buying a small share of the company, when the companies grow or makes profits the equity prices go up and investors make money. This asset class typically grow money in the long-term with short-term fluctuations.
- Domestic Equity: These are shares of companies operating and listed within your home country. Thrives when the local economy grows, interest rates are low, and consumption increases. However, they can struggle if high inflation forces central banks to raise rates.
- International Equity: These are shares in businesses located outside your home country. They perform well when foreign markets outgrow your local economy. Buying them protects your wealth from local recessions and drops in your home currency value.
- Debt (Fixed Income)
Investing in debt means lending money to governments or corporations in exchange of fixed interest payments and return of your principal amount at maturity.
- Recession Outperformance: As economic growth cools and central banks cuts interest rates, existing bond prices rise due to the inverse relationship between yields and bond prices.
- Inflation Risk: Debt underperforms relative to stocks. Central banks often raise interest rates to prevent the economy from overheating, which causes existing bond prices to drop.
- Physical Assets (Real Estate, Commodities, and Gold)
Physical assets are tangible real assets that hold intrinsic value because they are limited in supply and essential for daily global economic activity.
- Real Estate: Real estate values and rental yields generally rise due to high demand for housing and commercial spaces. Commodities (like oil and industrial metals) also rise as manufacturing and construction scale up.
- Commodities & Gold: This is where physical assets truly stand out. When inflation erodes the value of paper currencies, the prices of physical commodities tend to rise, acting as an effective structural shield for your wealth.
Correlation and Diversification
Portfolio resilience relies on correlation, how assets move relative to one another during phase transitions:
- During economic expansion, equities lead performance while debt provides modest, steady yield.
- During recessions, equity drawdowns are cushioned by price rallies in fixed-income debt as central banks lower interest rates.
- During inflationary shocks, paper assets (both equities and bonds) often decline simultaneously, while physical assets (gold, commodities, real estate) hold or increase in value.
Maintaining a multi-asset allocation ensures that gains in one category offset losses in another, smoothing long-term portfolio volatility.
Tactical vs. Strategic Allocation
- Strategic Allocation (Long-Term Framework):This approach sets a permanent baseline mix of assets based on your personal risk tolerance. You stick to this steady breakdown through all market conditions to guarantee diversification. It acts as the steady foundation of your portfolio, protecting you from making emotional decisions during sudden market crashes.
- Tactical Allocation (Cycle Rebalancing):This strategy involves making short-term, deliberate adjustments to your baseline mix to capture temporary opportunities. You temporarily increase investments in asset classes that are currently cheap or performing well due to the economic phase. This method allows you to actively boost returns or cut risk as economic cycles change. Like tilting toward high-quality government debt ahead of a recession or increasing physical assets when inflation spikes.
- The Hybrid Model (Core-Satellite Approach):This strategy combines both frameworks by splitting your portfolio into two distinct parts. The larger “core” portion uses a strategic allocation to maintain a steady, long-term multi-asset baseline for safety. The smaller “satellite” portion uses tactical allocation, allowing you to make nimble shifts to capture short-term opportunities across shifting economic phases.
Comprehensive Asset Class Comparison
| Feature | Domestic Equity | International Equity | Debt (Fixed Income) | Real Estate (Physical) | Commodities & Gold (Physical) |
|---|---|---|---|---|---|
| Primary Goal | Wealth Creation | Geographic & Currency Diversification | Capital Preservation & Fixed Income | Rental Yield & Capital Growth | Inflation Hedge |
| Risk Level | High | High (Includes Currency Risk) | Low | Moderate | Moderate |
| Ideal Horizon | 5+ Years | 5+ Years | 1–3 Years | 7+ Years | 3+ Years |
| Returns Type | Capital Gains & Dividends | Capital Gains & FX Movements | Interest Income | Rental Cash Flow & Appreciation | Capital Appreciation |
| Volatility | High | High | Low | Moderate | High |
| Liquidity | High | High | High | Low | High |
Historical Return Trends (Recent 5-Year Cycle: 2021 – 2025)
Tracking annual performance across market phases demonstrates how leadership rotates across asset classes over time:
|
Calendar Year |
Domestic Equity (Nifty 50) |
International Equity (MSCI World) |
Debt (India 10Y Yield) |
Physical Assets (Gold in INR) |
|
2021 |
25.60% |
21.82% |
6.45% |
-1.50% |
|
2022 |
5.70% |
-18.14% |
7.32% |
9.90% |
|
2023 |
21.30% |
23.79% |
7.17% |
15.00% |
|
2024 |
10.10% |
18.67% |
6.76% |
25.10% |
|
2025 |
11.90% |
21.09% |
6.58% |
92.70% |
Note: Historical returns reflect representative benchmark index annual performance across broad market cycles.
Strategic Takeaways
- No Single Winner: Outperformance shifts predictably as the economic phase transitions.
- Physical Assets Matter: Including real estate, commodities, and gold prevents systemic drawdowns when traditional equity and fixed income portfolios face inflationary stress.
- Rebalancing Works: Rebalancing capital out of outperforming assets into lagging, undervalued assets protect gains and positions portfolios for the next phase of the market cycle.
Sources- https://www.bajajamc.com/knowledge-centre/nifty-50-historical-returns
https://www-cdn.msci.com/documents/10199/4db922ce-68d2-446d-2f9e-4ed408a9db29
https://groww.in/blog/historical-gold-rates-trend-in-india
https://in.investing.com/rates-bonds/india-10-year-bond-yield-historical-data
Disclaimers.
- Investment in securities market are subject to market risks. Read all the related documents carefully before investing.
- Registration granted by SEBI, enlistment as IA with Exchange and certification from National Institute of Securities Markets (NISM) in no way guarantee performance of the intermediary or provide any assurance of returns to investors.
- The information is only for consumption by the client, and such material should not be redistributed.
- The securities quoted are for illustration only and are not recommendatory.
- Past performance is not an indicator of future performance.
- Please consult your investment advisor before investing.
- This material is for information and educational purposes only.
- Physical real estate / assets / Physical commodities/ Gold are not under the purview of SEBI and hence no recourse through SEBI is available to investors for any grievances related to such products or services.
- Details are at https://planahead.in/disclaimers-disclosures/